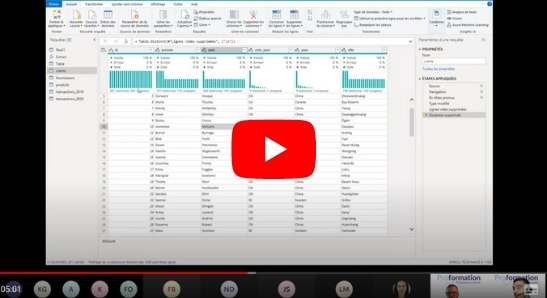
Create visual and interactive dashboards
Power BI now includes Power Query and PowerPivot and allows you to create rich and interactive dashboards thanks to the multiple graphic elements it offers.
This training will allow you to manipulate data and create your reports.
Our teaching approach, which is based on your objectives and your pace, will make you gain in confidence.


Our Power BI training program - the basics
- Introduction to Power BI
- Power BI workflow
- Power BI licenses
- Presenting the Power BI services and application
- Presenting the Power BI platform
- Presenting the Power BI Desktop
- Principle of connectors
- Integrating flat file type data (text, CSV), single or multi-tab Excel workbooks, Access databases, Web pages
- Launching the query editor
- Applying the transformations available in the editor
- Using the function of the transformation steps
- Defining the types of data
- Choosing rows and columns to keep, removing duplicates
- Adding a custom column, based on examples
- Adding queries to each other, based on identical columns
- Understanding profiling tools and column quality
- Mastering the global syntax of DAX formulas
- Choosing between calculated columns and measures
- Distinguishing between implicit measurement and explicit measurement
- Rapidly using DAX functions equivalent to Excel functions
- Automatically generating quick measurements
- Moving and formatting an explicit measure
- Mastering the first essential functions:
- DISTINCTCOUNT
- COUNTROWS
- CALENDAR, CALENDARAUTO
- FORMAT
- Discovering the CALCULATE function
- Correctly using the essential Time-Intelligence functions (SAMEPERIODLASTYEAR…)
- Creating and configuring visuals
- Tables and matrices
- Simple graphics
- Maps
- Segments, dropdown lists, timelines
- Using basic and advanced filters for visuals, pages and reports
- Inserting images, text boxes
- Managing interactions
- Creating a custom tooltip
- Connecting to the Power BI service
- Publishing a report to the Power BI service
- Exporting a report in PDF or Power Point format
- Creating and sharing a dashboard
- Subscribing to a dashboard
- Applying a simple security role
Training program: Power BI data analysis
- Importing identical files from a folder
- Connecting to a database (import or direct query), a cube (import or live connection)
- Exporting a Power BI file as a template (.pbit)
- Merging queries on the principle of SQL joins
- Handling errors
- Directly modifying the M language
- Using list objects
- Using settings
- Setting up M functions
- Optimizing queries
- Using query diagnostics
- Building a star schema
- Many-to-many relationship management
- Applying cross filter direction (bidirectional)
- Understanding the notion of row context, filter context
- Using the DAX function families:
- Time Intelligence functions: DATEADD, DATESYTD, DATESBETWEEN…
- Iterative functions: SUMX, AVERAGEX, MAXX, MINX…
- Filter functions: CALCULATE, ALL, FILTER, RELATEDTABLE
- Table functions: SUMMARIZE, CALCULATETABLE
- Other functions: HASONEVALUE, VALUES
- Using DAX Studio to develop advanced DAX syntaxes
- Creating a segment driving the choice of measures for a visual
- Using a theme that increases the size of all fonts
- Displaying images in a segment
- Adding buttons, bookmarks and selections
- Adding an R or Python visual object
- Using advanced interactions and extraction
- Configuring conditional formatting
- Creating a read or write application workspace
- Applying advanced line security (RLS) policy
- Introduction to paginated reports
- Creating paginated reports
- Using gridlines and object alignment
- Adapting visuals for mobile display
- Configuring interactions and explore a visual using hierarchies
- Distributing a report or dashboard
- Monitoring usage and performance level
- Configuring data protection
- Using a Power BI gateway to connect to local data sources
- Configuring a scheduled dataset refresh
- Configuring incremental refresh settings
- Managing and promoting datasets
- Troubleshooting service connectivity issues
- Using the performance analyzer to optimize a report
- Discovering the Power Platform (Power Apps, Power Automate, etc.)
- Embedding a report in a SharePoint Site or intranet
How does it work?
Our training programs have been developed as real remote “coaching” type support sequenced in several appointments of 1h45 each.
This is the ideal solution for acquiring new skills during appointments with your trainer and for experimenting with them in between sessions in your personal and/or professional context.

Live Video Training
Your training, individualized and personalized, is led remotely by a trainer who is assigned to you.
Accessible: Our training courses are easy to implement whatever your professional context.
How? A computer and an internet connection are enough to take the training.
Flexible: We guarantee scheduling that is completely consistent with your schedules.
How? Via our planning tool by smartphone or pc.
Consistent: Your trainer follows you wherever you are.
How? We offer you a quality initial audit, an expert trainer, resources adapted to your context, a recognized certification.
Economical: With a controlled environmental impact, our remote learning courses allow you to focus on your educational objectives.
How? We take care to remove any ancillary charge.

The trainers
Our trainers all have extensive experience in corporate training. They are constantly supported by our teaching managers and are the referents who guarantee the involvement of the participant. Together they transform a simple journey into a real learning curve. Each participant has a referent trainer and an alternate trainer, in response to their schedule constraints.
Questions on our Power BI B2B training courses?
Our team is at your service


